Subscription prices go up October 15! Lock in a lower permanent rate now! https://thegoldadvisor.com/product/the-paydirt-silver-bundle/
Subscription prices go up October 15! Lock in a lower permanent rate now! https://thegoldadvisor.com/product/the-paydirt-silver-bundle/
Jeff Clark, TheGoldAdvisor.com
It’s a popular question right now, whether the crash in gold and silver is over, or if another one is right around the corner.
On Monday August 5, gold fell $100, a 4% selloff. Silver crashed over 8%.
As you likely heard, all markets crashed due to the “unwinding of the yen carry trade.” The BOJ hiked their interest rate, causing the yen to appreciate rapidly against the US dollar. Investors that borrowed in the low-interest-rate yen and invested in higher-yielding assets elsewhere, suddenly found that trade unprofitable and began exiting. Virtually all markets around the world were affected.
Gold and silver have since regained some of their decline—gold ended last week flat and silver was down 3%—but the crash was so sudden and violent that it probably has you asking the same thing many precious metals investors are asking: is that it? Are we out of the woods now?
It’s an important topic, since it would tell us whether to wait for more downside before buying—or buy now before things take off again.
But the answer to that question is one you already know. In fact, everybody knows it. It’s not one we may like but understanding it can make us better investors.
NOBODY KNOWS.
There are lots of predictions and projections out there, some even declared with absolute certainty. JPMorgan said on August 9 that it believes the unwind is only about halfway done.
But of course, everyone is just giving their best guess. And even if JP Morgan is correct, for example, markets may not react the same way or in the manner they assume they will.
I take a different approach. Instead of trying to formulate a professional guess.
I like looking at gold through the lens of history. It’s not a guarantee, but it does give one a realistic and balanced perspective about corrections.
And what history shows about gold’s behavior is indeed both insightful and useful.
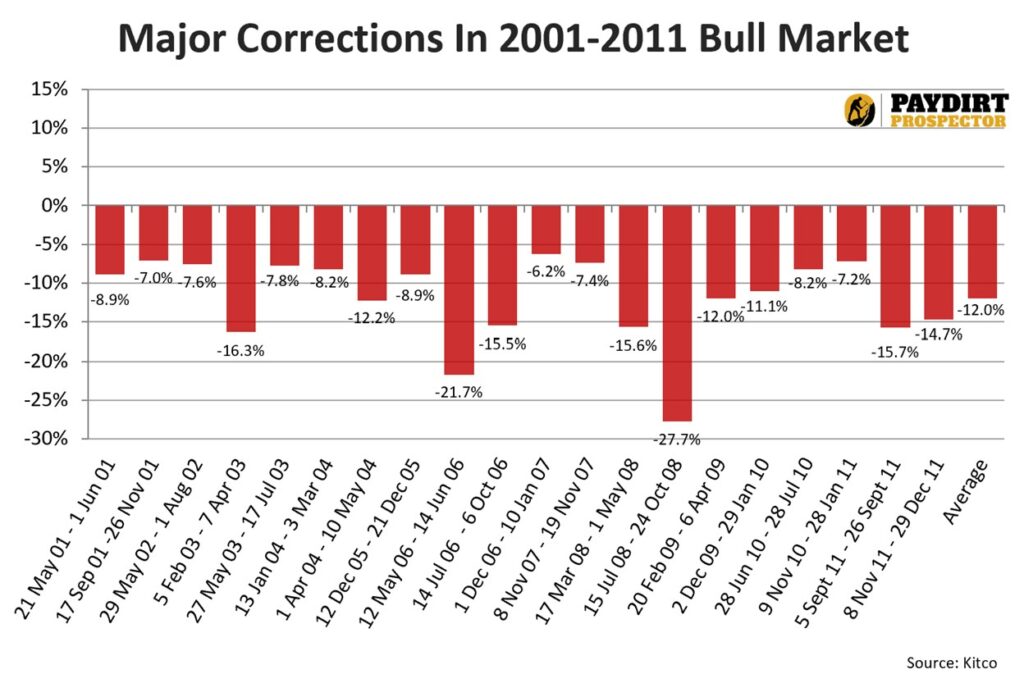
First, I documented all the corrections in gold’s last bull market, and this is what is shows.

Believe it or not, there were 20 corrections of 6% or more in the gold price during that decade-long bull market. And look at the bar on the far right—the average correction was 12%! Take out the 2008 crash and they still averaged 10%.
Even during gold’s parabolic rise from late 1978 into January 1980, there were seven corrections of 6% or more, with an average of 10.7%. In a mania!
This is the first key point in understanding how to play corrections.
Internalizing this in your psyche and incorporating it into your strategy can give you power. It means you will expect corrections and not be emotionally affected by them.
You’ll also know they offer a window to grab a stock that got away from you earlier or add shares of one you want more of. You might say…
There’s no need to be surprised when gold and silver decline. It doesn’t mean you’ll buy something every time, but it does give you power knowing it’s a normal part of a bull market.

Of course, corrections are only part of a bull market. Let’s take a look at the surges the gold price had in a rising price environment.
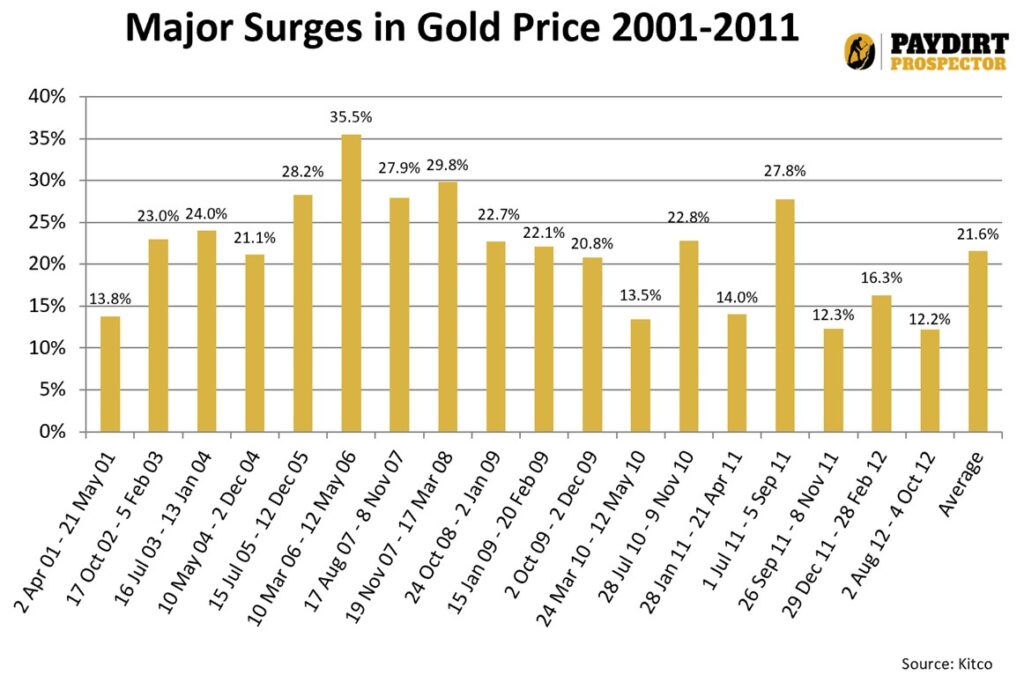
This chart documents all the major surges in the gold price during the same bull market.
Over this 11-year period, there were 18 surges in the gold price of 12% or greater. You can see from the bar on the far right they averaged 21.6%.
This tells us that like big corrections, big surges are normal. These can be fun periods, of course.
But naturally all surges eventually cool. This hints directly at the second part of our strategy.
Put these charts together and we have the proverbial two steps forward-one step back type of climb in a bull market.
We don’t know how big a correction or surge will be—another guessing game—but they do give us windows to buy and windows to take profits. Especially on big moves in either direction.
Using these windows to our advantage can lead to bigger gains. I can tell you that following this strategy has been very profitable for me.
I added to several of my mining stocks during the correction. They’re in Paydirt Prospector, along with 26 other gold, silver, copper, uranium and lithium stocks. It’s my personal portfolio, one I encourage you to consider too—before the next surge kicks in.